Analyses of template switch mutations
DNA replication-related template switching is a poorly understood mutational mechanism capable of causing major chromosomal rearrangements as well as creating short inverted sequence copies that appear as local mutation clusters in sequence comparisons.
Short-range template switch mutations (TSMs) are especially interesting as they can create small inversions or reverse-complement repeats. The latter can then form hairpin structures, potentially affecting the regulation and function of genes.
Twitcher and Twitcher Workbench are tools for identification and annotation of mutation clusters created by short-range template switching.
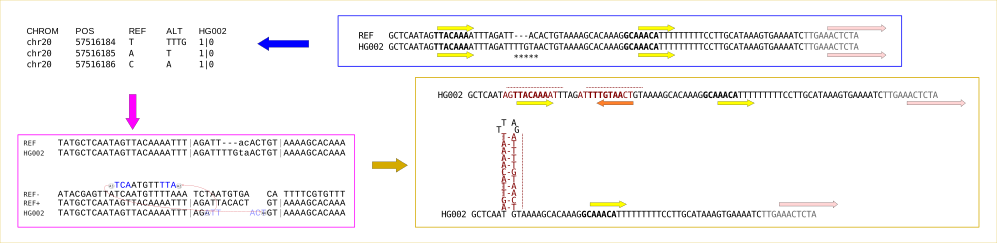
In the figure below, a cluster of base changes (blue box) doesn’t affect the hypothetical binding sites (yellow arrows) and mutations are considered harmless. Twitcher analysis (magenta box) reveals that the cluster has been created by template switching. This allows re-annotating the variants (yellow box) and shows that the mutation has created a reverse-complement copy of the binding site (orange arrow) and enables a hairpin structure, potentially disrupting the expression of the gene.
Twitcher
Twitcher is a command-line program for the analysis of TSMs using VCF and BAM data. Twitcher is designed for medical genetics and clinical diagnostics, but it works for any genome data.
Twitcher finds mutation clusters either in VCF data or in individual reads of PacBio HiFi data. VCF data typically represents consensus call for an individual and allows studying germline mutations. HiFi reads carry both multi-copy germline and unique somatic mutations, distinguished from their copy numbers, and allow studying both germline and de novo mutations. With both data types, Twitcher creates the alternative allele and tries to realign it with the reference genome allowing for template switching. Successful alignments are stored in compact VCF format (VCF data only) or in a more informative CSV format.
Example of Twitcher analysis
The VCF file below describes a mutation cluster in chr11 of NA24385/HG002.
##fileformat=VCFv4.2
##reference=file://hg38.no_alt.fa.gz
##contig=<ID=chr11,length=135086622,md5=1511375dc2dd1b633af8cf439ae90cec>
##FORMAT=<ID=GT,Number=1,Type=String,Description="Genotype">
#CHROM  POS ID  REF ALT QUAL    FILTER  INFO    FORMAT  NA24385
chr11   133464064   .   CCC C   .   .   .   GT  0|1
chr11   133464068   .   A   C   .   .   .   GT  0|1
chr11   133464070   .   A   T   .   .   .   GT  0|1
chr11   133464071   .   G   T   .   .   .   GT  0|1
chr11   133464072   .   A   C   .   .   .   GT  0|1
Having the VCF file and a copy of the reference genome, we can run Twitcher with the command:
twitcher vcf --reference hg38.no_alt.fa.gz -o temp.out.vcf.gz --csv temp.out.csv temp.vcfThis produces two output files, one in compressed VCF format and the other in CSV format. We can visualise the inferred TSM event using the CSV file:
twitcher viz --reference hg38.no_alt.fa.gz -o svgs/ -z 10 -a -e full temp.out.csvThis produces an SVG file:
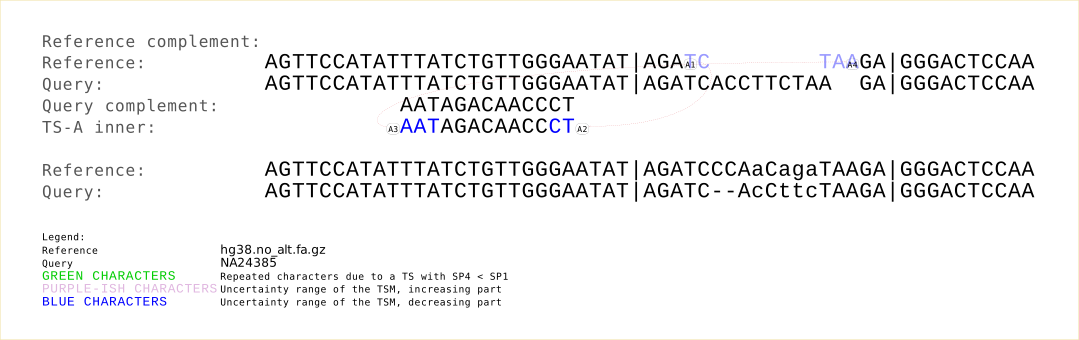
The output reveals that the haplotype carried by NA24385/HG002 is, in fact, the ancestral state and the reference is the derived form.
A more comprehensive Twitcher command for CSV data could look like this:
twitcher vcf \
  --reference $ref --phasing-bam $bam $vcf \
  --regions $chr --db known_clusters.$chr.db \
  --output $out.$chr.vcf.gz --csv $out.$chr.csv \
  --stat-output $out.$chr.stats.txt \
  --output-failed-alignments $out.$chr.failed.txt \
  --output-unresolvable $out.$chr.unresolvable.txt \
  --output-alignment-stats $out.$chr.alignment-stats.txt \
  --cluster-strategy edit-mass --only-realigned \
  --memory-limit 4gb --threads 10
Here, the first line defines the reference genome ($ref), the BAM file used for variant phasing ($bam) and the input VCF file ($vcf). The second line restricts the analysis to a specific chromosome (allowing for parallelisation and more specific outputs) and defines a database file for known clusters. This DB works as a cache and allows for resolving known cases, either in the same individual or in other individuals, without the alignment step. The following lines define various kinds of additional outputs: stats is a simple summary, failed and unresolvable list regions that could not analysed e.g. due to out-of-memory errors or VCF being inconsistent (and thus non-phasable) with the given BAM file. alignment-stats gives highly detailed information of each cluster. The second last line defines the cluster detection strategy and limits the VCF output to realigned regions only. The last line defines the memory for each thread and the number of threads.
It is notable that the reproducability of the results and the DB cache depend on the amount of memory provided. The DB records the amount of memory used and a cluster with OOM error is not retried unless more memory is provided.
A command for PacBio HiFi BAM data could look like this:
twitcher reads \
  --reference $ref $bam \
  --regions $chr --db known_clusters.$chr.db \
  --output $out.$chr.csv \
  --stat-output $out.$chr.stats.txt \
  --output-failed-alignments $out.$chr.failed.txt \
  --cluster-strategy edit-mass \
  --memory-limit 4gb --threads 10
The main difference is that the output can be in CSV format only and each read with a copy of (germline) mutation is reported as an independent line in the CSV file. (This highly redundant CSV output can be deduplicated with Twitcher Workbench.) Even when no DB file is specified, Twitcher uses within-run cache of known clusters, massively speeding up analyses of BAM data.
See the full instructions for using Twitcher.
Twitcher Workbench
Twitcher Workbench (TWB) is a graphical interface for visualisation and postprocessing of the Twitcher CSV output. TWB annotates the events with gene and repeat information, groups homologous events, and provides a language for complex filtering operations. Its grouping algorithm can deduplicate multi-copy germline events from BAM data and identify identical mutations in family data or data analysed on multiple platforms (e.g. independent sequencing runs, different variant calling pipelines).
TWB’s processing and filtering functionality is also available as a command line tool.
A demo server running the TWB web UI.
Example of Twitcher Workbench GUI analysis
Input CSV data
HG002 and his parents HG003 and HG004 were called with GATK and analysed with Twitcher. The CSV files for chr11 were combined with:
csvtk concat HG00[234]_chr11.csv > ASH_chr11.csvThe combined file is available at data/ASH_chr11.csv for post-processing and visualisation in Twitcher Workbench.
TWB settings
The Settings panel on the top-right shows that the “hg38” reference and annotation files are selected (top half) and the CSV processing includes all analysis steps (bottom half).
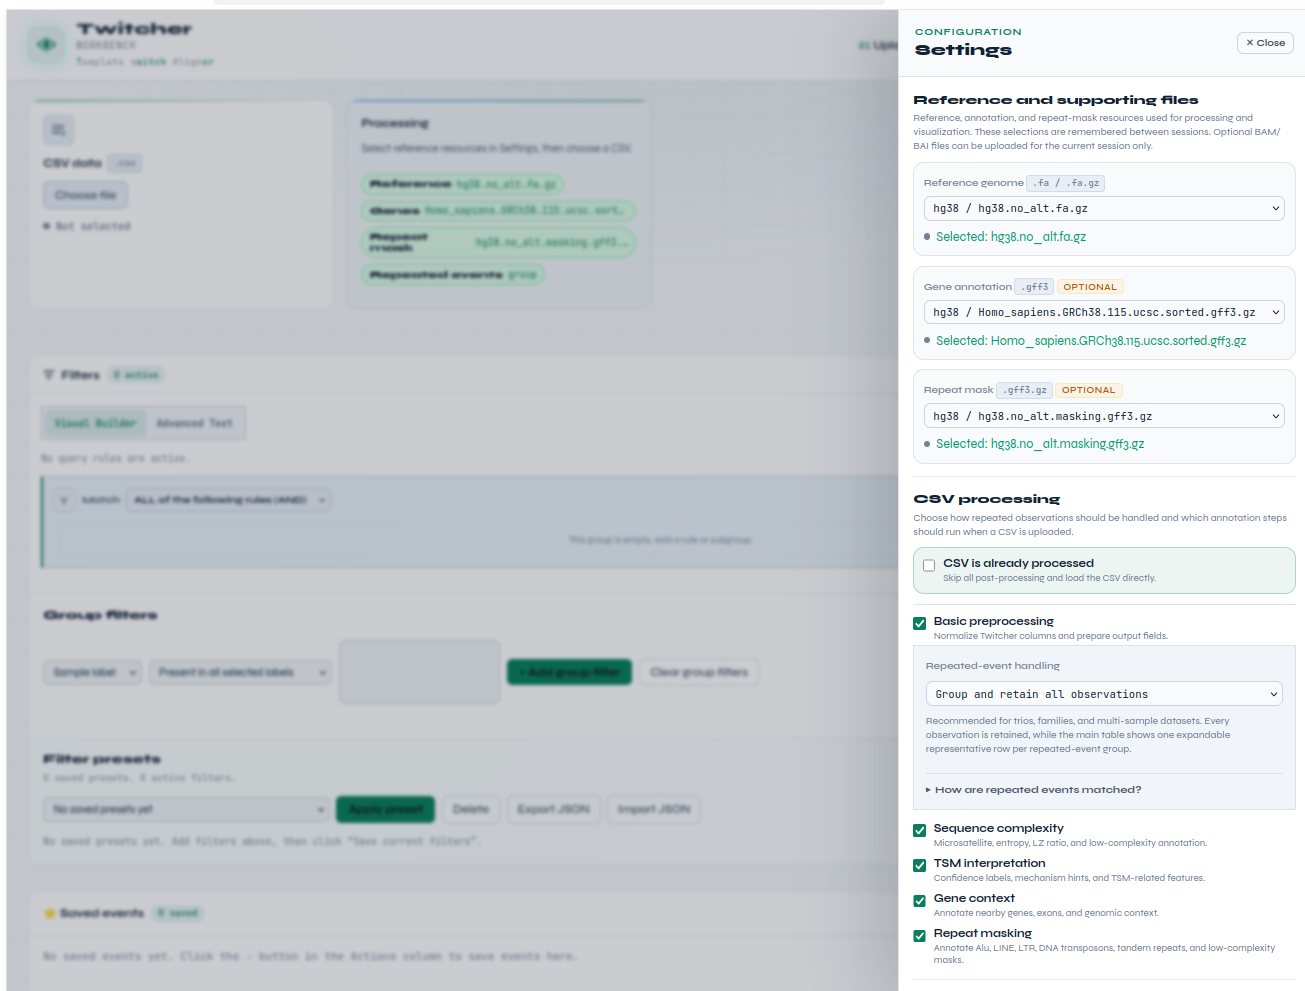
The Settings panel additionally includes menus to adjust the visualisation tools and select/order CSV columns.
Data import
Selecting the CSV file (top-left) starts the processing. Once finished, a summary of the data is displayed and the full CSV is shown at the bottom of the page.
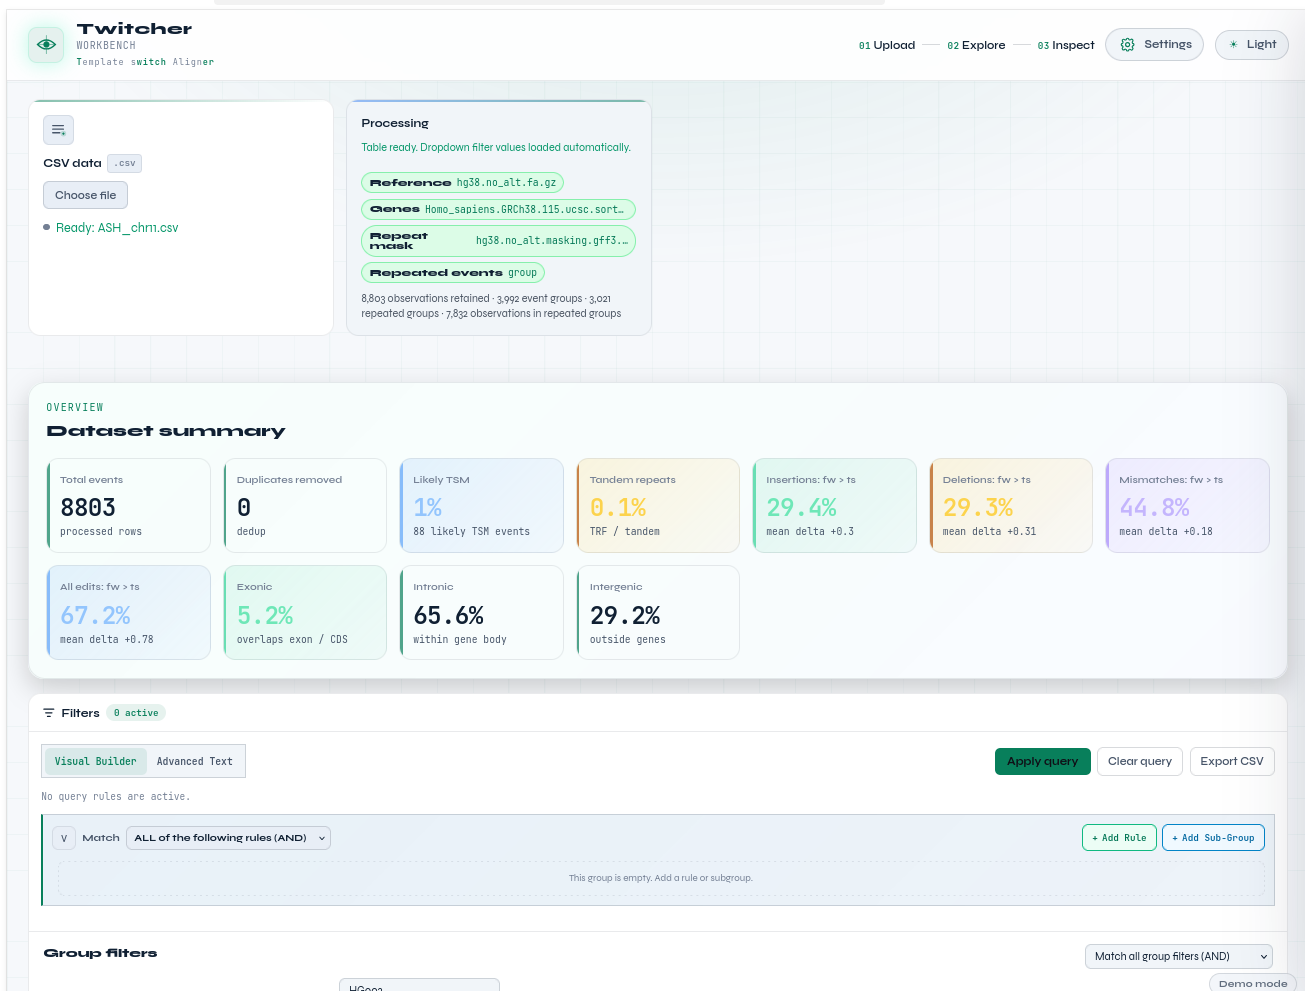
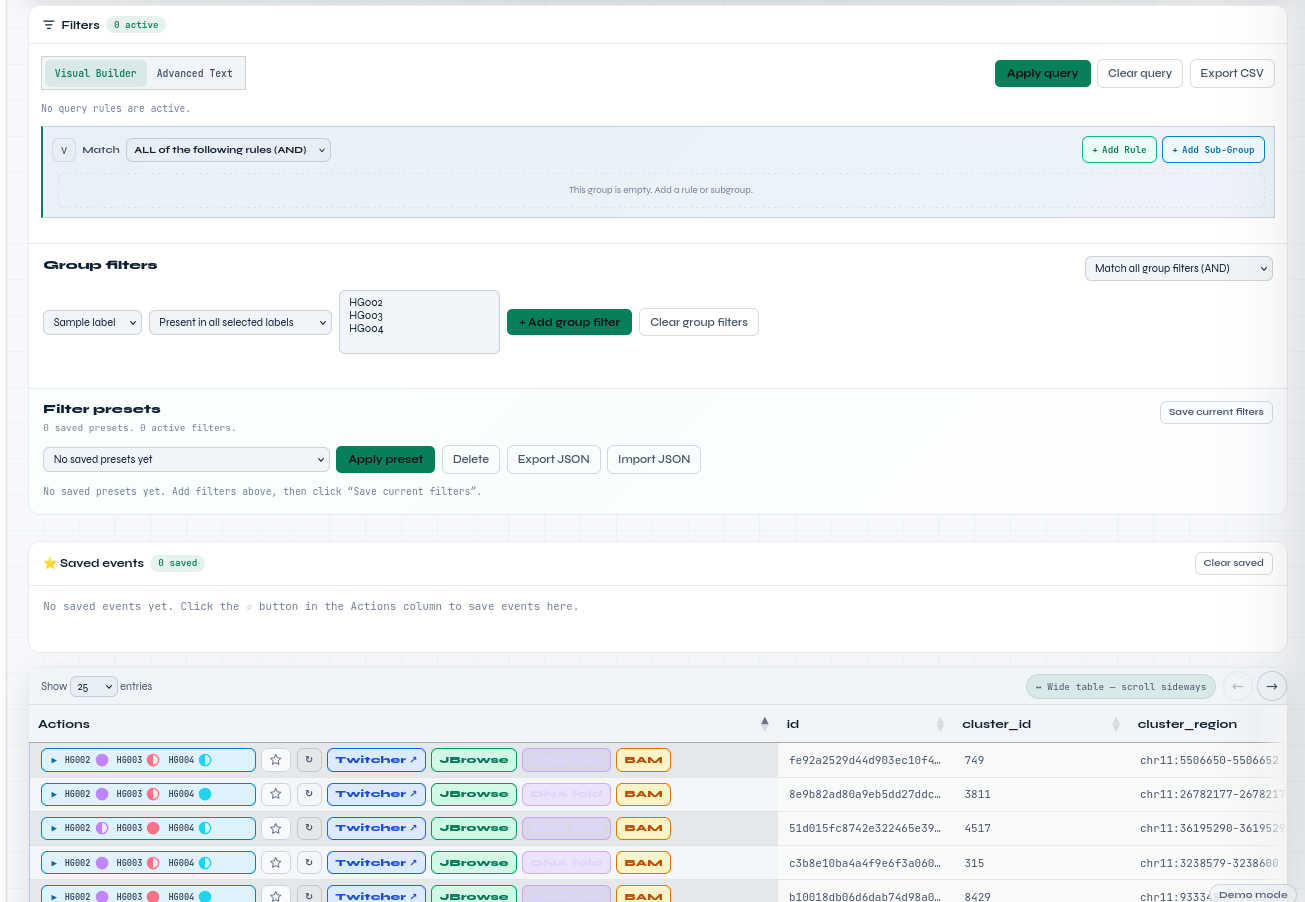
The button “Export CSV” allows exporting the full processed data.
Data filtering
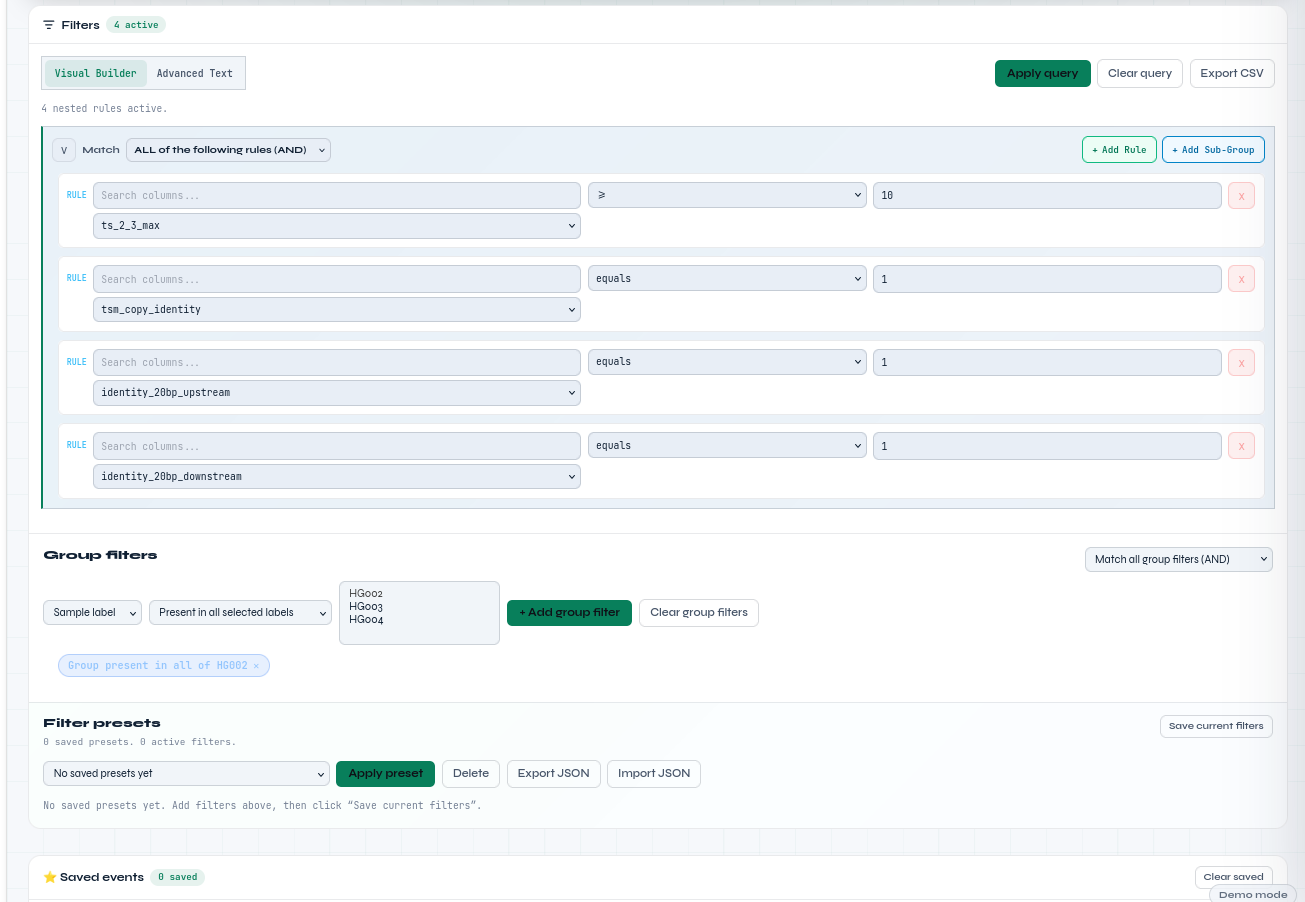
The Filter menu allows building complex filtering combinations, setting presets, and exporting and importing the filtering parameters in JSON format.
Below are some basic filtering choices. The first menu filters TSM events of 10 bp or longer (ts_2_max>=10) fully explaining the mutation cluster (tsm_copy_identity==1, identity_20bp_up/downstream==1). The second menu selects events present at least in the sample HG002.
TSM visualisation
In the end, Twitcher Workbench is a CSV file browser and data visualiser. The CSV columns to show can be selected and ordered in the Settings menu, and the data can be sorted by clicking the column headers.
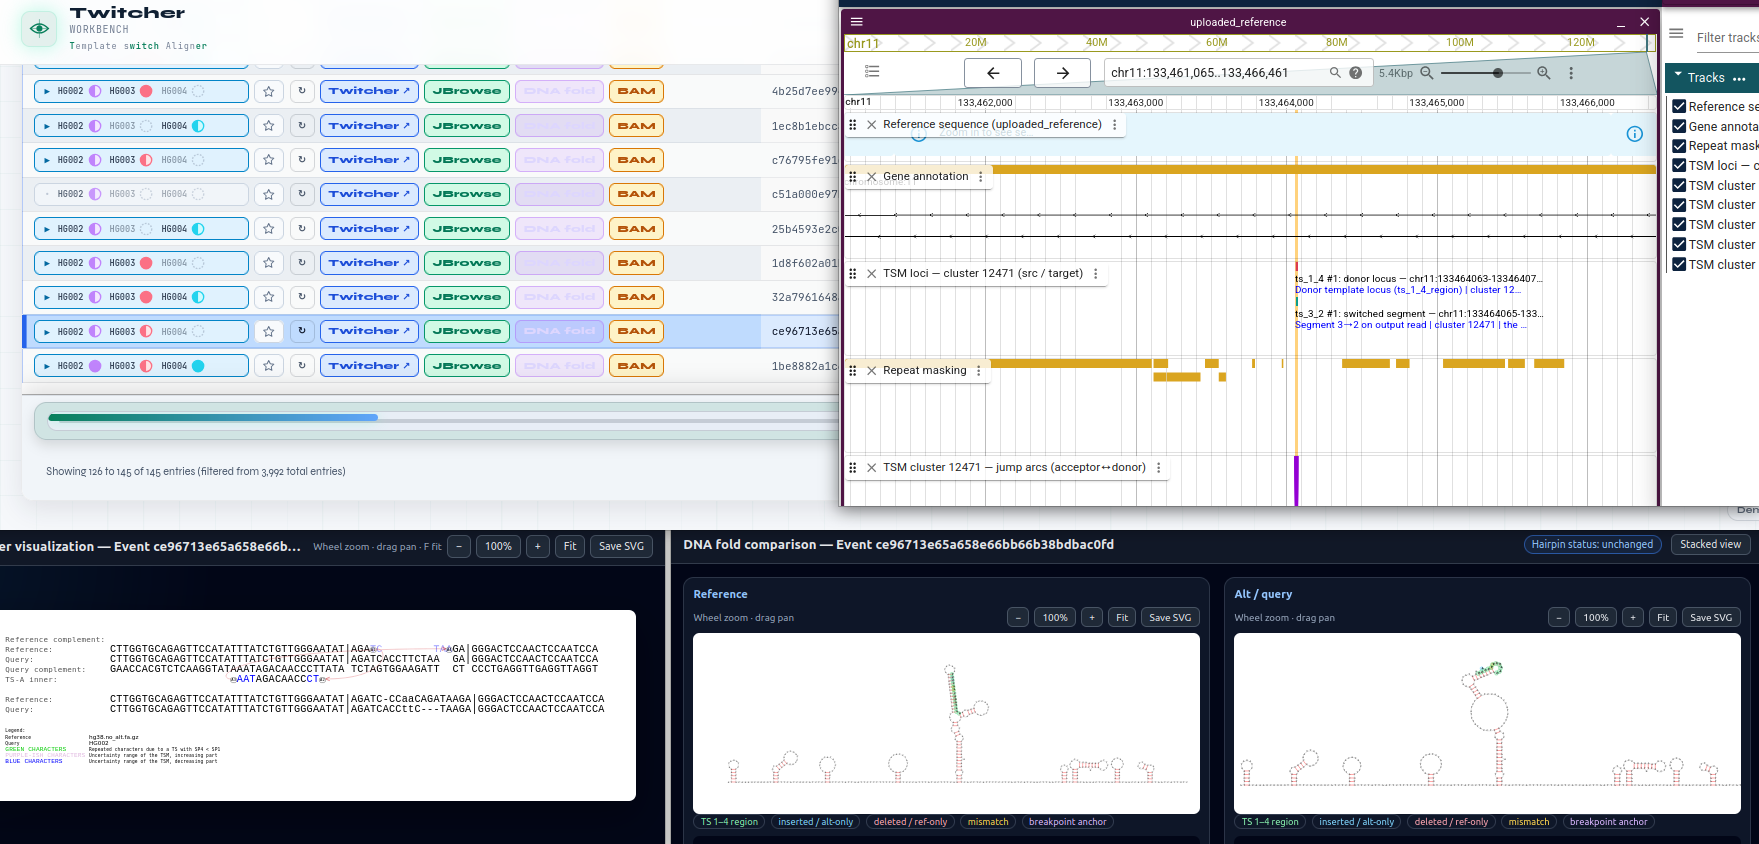
Below, three integrated visualisation tools are shown. The selected line contains the locus analysed earlier with Twitcher. (The mutation cluster is the same but the read alignment and subsequent variant calling differ from that shown above.) The event is heterozygous (◐) in HG002 and HG003 and absent (◌) in HG004. “Twitcher” and “DNA fold” buttons open new windows showing the inferred TSM mechanism and the folding of the REF and ALT alleles (bottom). “JBrowse” button opens the genomic browser and shows the locus in its gene context (right).
Export and import of processed data
The button “Export CSV” allows exporting and saving locally the current selection of data. This saves time in analyses of large data sets and allows sharing snapshots of filtered data.
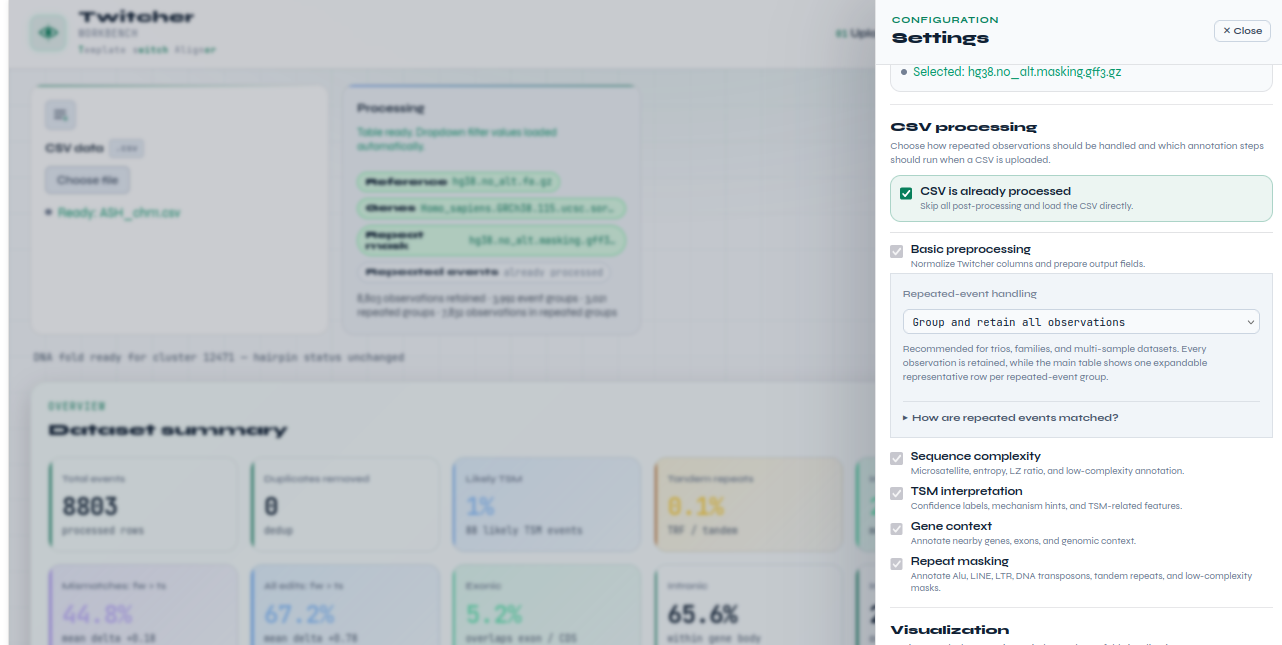
When importing processed data, the box “CSV is already processed” should be selected in the Settings menu.
Example of TWB CLI analysis
The gene and repeat annotation of large CSV files can be time-consuming. It is practical to perform these steps with twb cli on a compute cluster and import the data in the processed form to TWB for filtering and visualisation only. When working with CSV files, it is useful to have csvtk, available at https://bioinf.shenwei.me/csvtk/, installed on the system.
The output of multiple individuals/platforms/pipelines can be concatenated with csvtk concat:
csvtk concat HG00[234]_chr11.csv > ASH_chr11.csvThis can then be annotated and deduplicated with the twb cli command:
twb cli -r $ref -g $genes -m $repeats -o ASH_chr11.processed.csv ASH_chr11.csvHere, $ref is a standard reference genome in FASTA (fa.gz) format, $genes is a gene annotation file in GFF3 (gff3.gz) format, and $repeats is annotation of various types of repeats in GFF3 (gff3.gz). The annotation adds a large number of new columns in the new CSV file:
wc  ASH_chr11*.csv
    8804     8804  3135615 ASH_chr11.csv
    8804   766339 15674534 ASH_chr11.processed.csv
The processed CSV file can now be filtered using various criteria. The example shown for the GUI is replicated with the command:
twb cli -O -A all \
  -f ts_2_3_max:gte:10 -f tsm_copy_identity:eq:1 \
  -f identity_20bp_upstream:eq:1 -f identity_20bp_downstream:eq:1 \
  --group-filter 'sample_name:group_has_all:HG002' \
  -o ASH_chr11.filtered.csv ASH_chr11.processed.csv
Here, the first line tells that the data are already processed and only filtering is done (-O) and that all filtering conditions have to be true (-A all). The filtering conditions are evaluated column-wise (-f ....) or group-wise (--group-filter ...).
See the full instructions for using Twitcher Workbench.